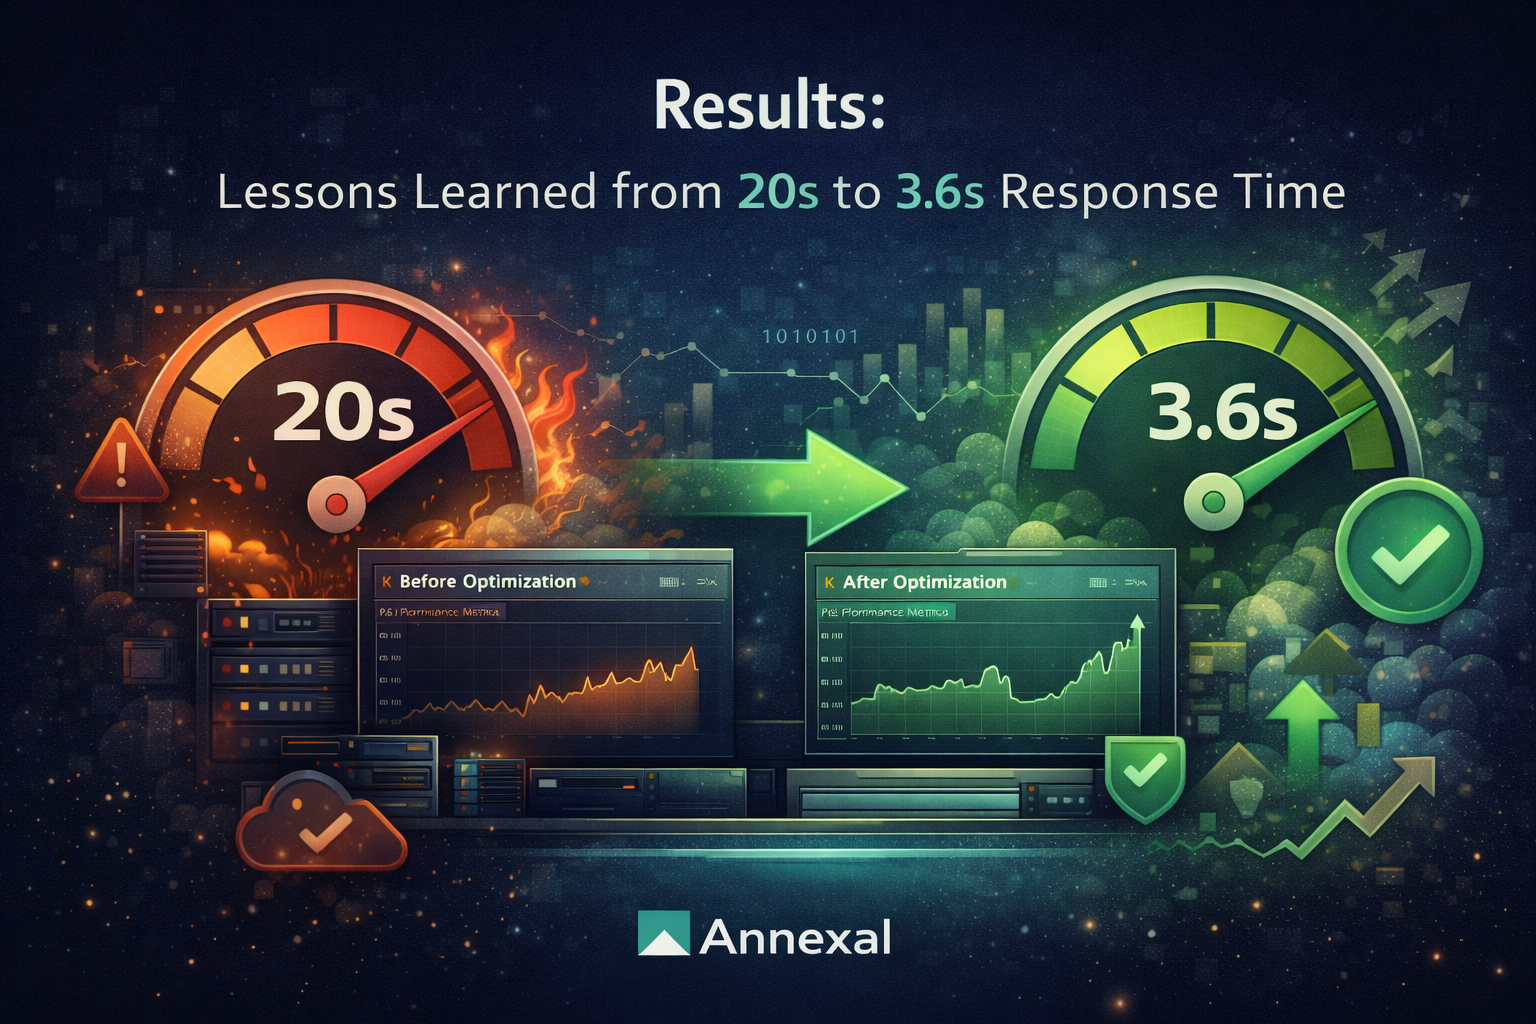
Five parts. Ten working days. One WooCommerce site taken from essentially unusable to production-ready. Here’s the complete before/after, the ROI breakdown, and the 10 lessons that apply to every performance project we’ll do from here.
Server upgrade: ~$200–500/month saved | Managed hosting migration: ~$500–1,000/month saved | Lost sales from downtime: estimated $1,000s/month. Payback period: immediate.
10 lessons that apply to every WooCommerce project
1
Measure before you optimiseWithout load testing you’ll never know that 1 user performance means nothing. Always start with K6 or equivalent before touching anything.
2
Fix the biggest bottleneck firstOne plugin caused 60% of the problem. The Pareto principle is real — find the one thing causing 80% of the pain and fix that first.
3
Plugin popularity ≠ plugin qualityThe worst offender had 10,000+ installs and 4.5 stars. Audit every plugin with Query Monitor. Measure actual impact, not reputation.
4
Database indexes are non-negotiableOne missing index caused a 10x slowdown. WordPress doesn’t add all necessary indexes by default — especially for WooCommerce + WPML stacks.
5
WPML is a performance taxAdding 225 queries per page is the cost of multilingual support. Budget extra optimisation time for any site using WPML, or evaluate Polylang as a lighter alternative.
6
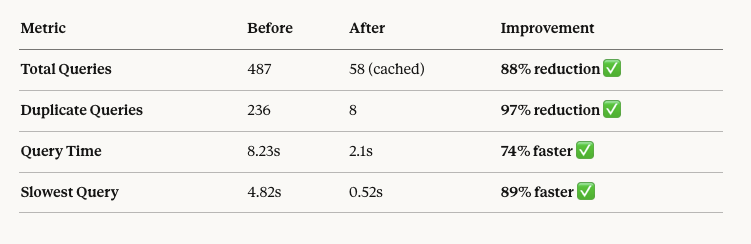
Redis is worth the setup time5 hours of setup eliminated 236 duplicate queries and delivered an 81% reduction in database calls. Should be standard on every WooCommerce site.
7
Fix bugs before optimisingApplying caching to a broken site just hides the problems. Phase 1 emergency fixes were a prerequisite for everything else — you cannot optimise a broken foundation.
8
One change at a timeIf you stack multiple changes, you won’t know which one worked — or which one broke something. Discipline here pays dividends when things go wrong.
9
Migration is never just “move files”MariaDB version mismatches, PHP config differences, and default settings cause cascading issues that only appear under load. Every migration needs a full post-migration load test.
10
Optimise before you scaleThe instinct was to upgrade the server. The right move was to fix inefficient code. Scaling a broken system just costs more money for the same bad experience.
Series complete
Read the full case study from the beginning
Start with Part 1 to see the full journey from a broken post-migration site to a production-ready WooCommerce store.