How We Fixed a Broken WordPress Admin Dashboard (Without Rebuilding the Website)
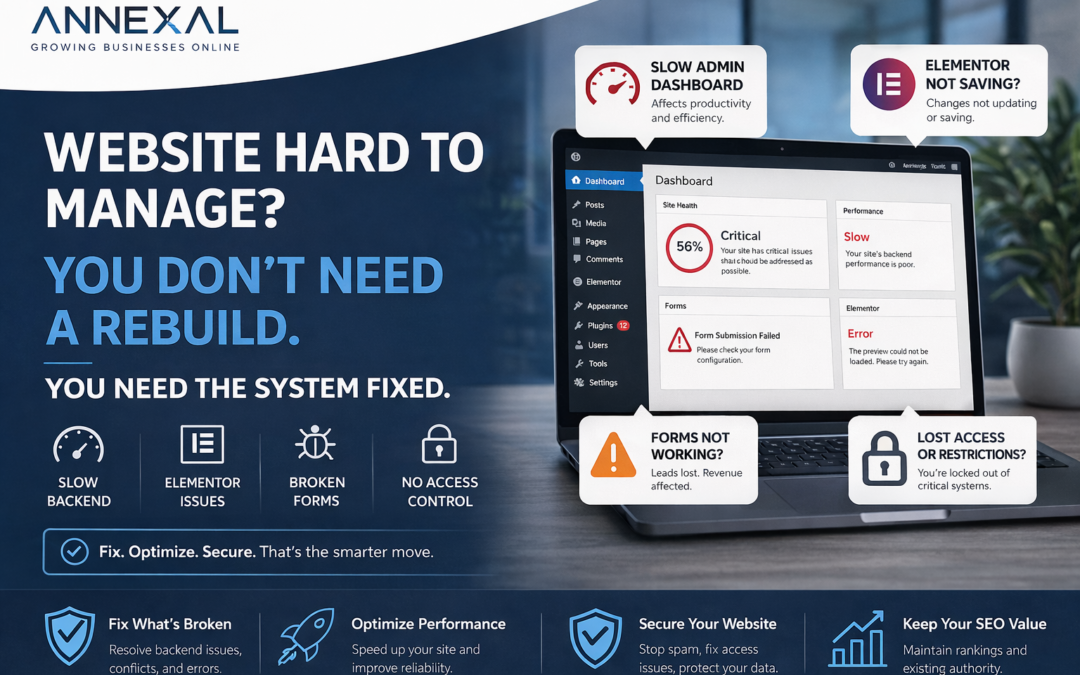
When Your Website Works… But You Can’t Use It Download Checklist A website doesn’t need to be down to be a problem.In fact, some of the most damaging issues happen when: Your team can’t make updates Changes don’t save Forms behave unpredictably The backend feels slow...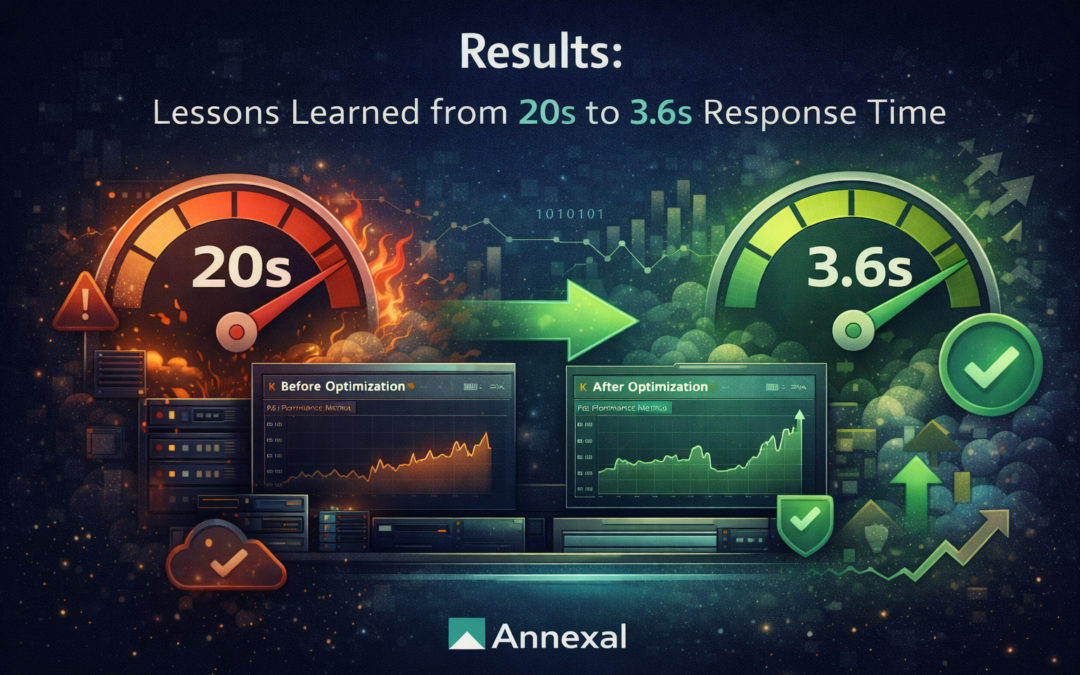
Results & Lessons Learned: From 20s to 3.6s Response Time
Introduction We’ve reached the final post in this 5-part case study. Let’s recap the journey: Part 1: Discovered critical migration bugs causing database corruption and memory exhaustion Part 2: Set up comprehensive load testing with Grafana K6 to measure...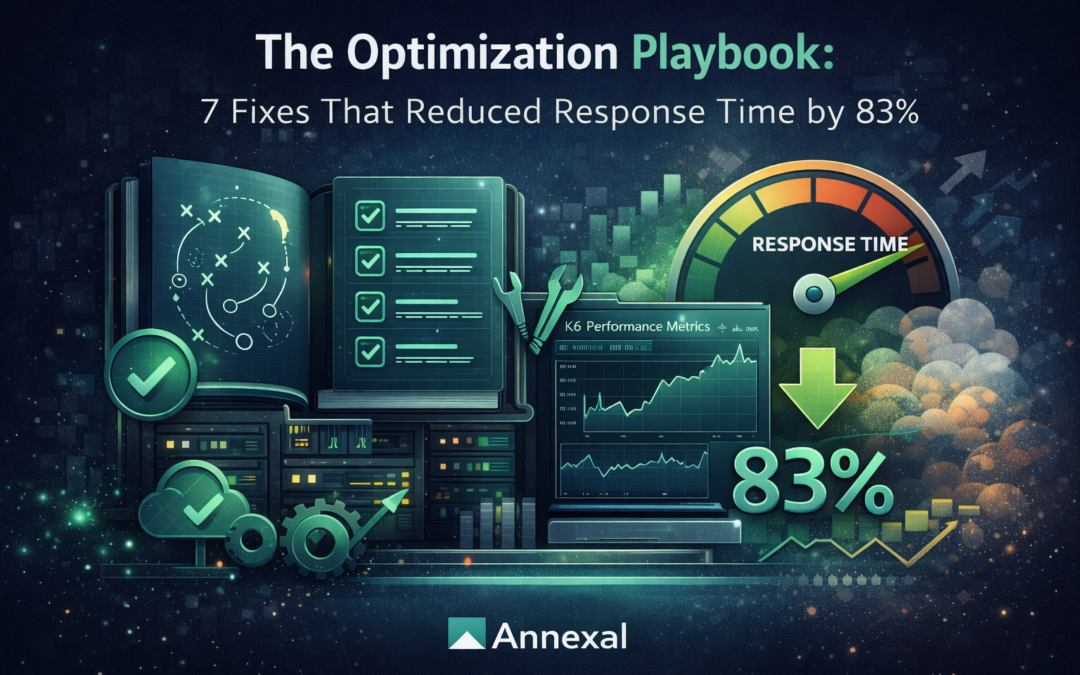
The Optimization Playbook: 7 Fixes That Reduced Response Time by 83%
Introduction In Part 3 of this series, we identified the exact bottlenecks killing our WooCommerce site’s performance: WC Global Product Order plugin – 4x meta JOIN adding 4.82 seconds per query 236 duplicate queries – Wasting 43% of database time...
Finding the Bottleneck: Database Query Analysis
Introduction In Part 2 of this series, we set up comprehensive load testing with Grafana K6 and discovered shocking performance metrics: 23-second response times at 95th percentile 23% error rate under moderate load Exponential degradation with concurrent users...