5-Part Case Study Series
Part 2: Load Testing with K6
Part 3: Finding the Bottleneck
✅ Part 4: The Optimisation Playbook (You are here)
Part 5: Results & Lessons Learned
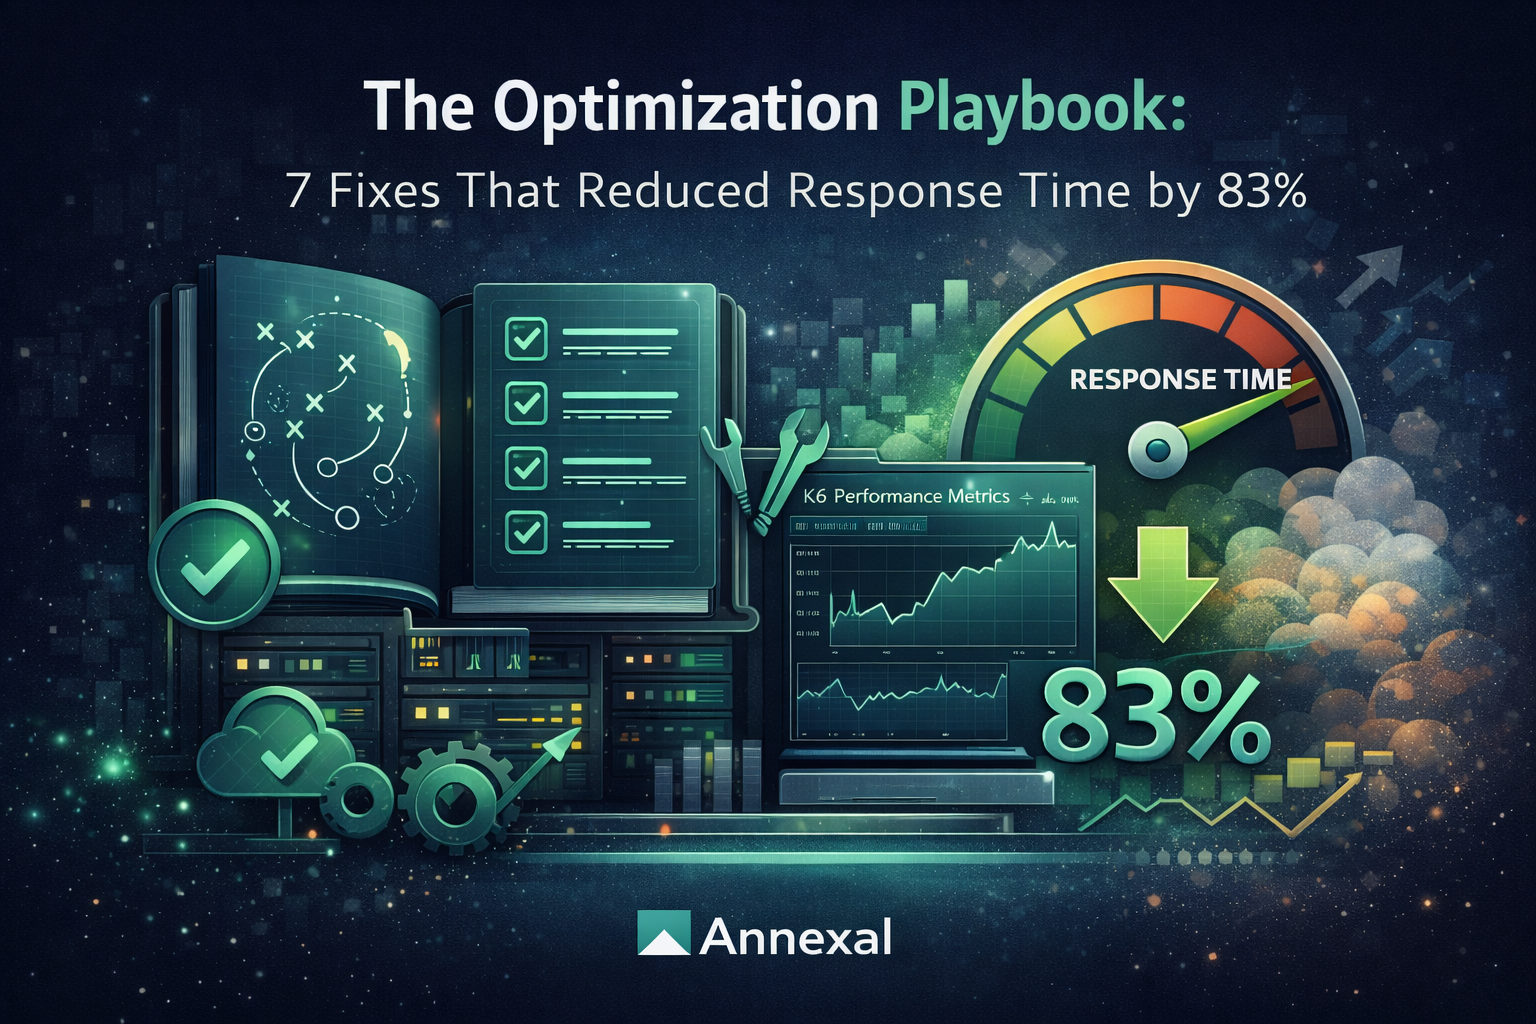
In Part 3 we identified the exact bottlenecks — a plugin adding 4x meta joins, 236 duplicate queries, missing indexes, and WPML overhead. Now it was time to fix them. Here are the 7 specific optimisations that took response times from 20+ seconds down to 3.6 seconds.
Before
After
Improvement
Our optimisation strategy
Before touching anything, we established five rules:
- Measure everything — K6 load test before and after every change
- One change at a time — never stack changes, you won’t know what worked
- Biggest impact first — high impact, low effort goes first
- Document everything — baseline metrics, change made, result
- Have a rollback plan — database backup before every change
Fix 1: Remove WC Global Product Order plugin
Effort: Low
This plugin caused 75% of the performance problem by adding 4x postmeta JOINs to every product query. First we verified how many products were using custom ordering, exported the data, then deactivated the plugin and switched to WooCommerce’s built-in popularity ordering — which uses an indexed meta field:
-- Check how many products use custom ordering
SELECT COUNT(*) FROM wp_postmeta
WHERE meta_key = '_wc_gpo_custom_order';

-- Deactivate via WP-CLI
wp plugin deactivate woocommerce-global-product-order
// Switch to built-in popularity ordering (already indexed)
add_filter('woocommerce_default_catalog_orderby', function() {
return 'popularity';
});Result after Fix 1:
Average response: 20.3s → 8.1s | p95: 30s → 15.2s | Queries: 487 → 312 | 60% improvement
Fix 2: Add critical database indexes
Effort: Low
Always back up first, then add indexes to the most queried columns:
-- Backup first
wp db export backup-before-indexes.sql

-- postmeta indexes
ALTER TABLE wp_postmeta ADD INDEX idx_meta_key (meta_key(191));
ALTER TABLE wp_postmeta ADD INDEX idx_post_meta_key (post_id, meta_key(191));
ALTER TABLE wp_postmeta ADD INDEX idx_meta_key_value (meta_key(191), meta_value(50));

-- WPML translation indexes
ALTER TABLE wp_icl_translations ADD INDEX idx_element_id (element_id);
ALTER TABLE wp_icl_translations ADD INDEX idx_element_lang (element_id, element_type(50), language_code(10));
ALTER TABLE wp_icl_translations ADD INDEX idx_trid_lang (trid, language_code(10));

-- WooCommerce product lookup indexes
ALTER TABLE wp_wc_product_meta_lookup ADD INDEX idx_product_id (product_id);
ALTER TABLE wp_wc_product_meta_lookup ADD INDEX idx_stock_onsale (stock_status(20), onsale);
Result after Fix 2:
Average response: 8.1s → 4.3s | Query time: 6.8s → 2.1s | Slowest query: 1.91s → 0.52s | 47% improvement
Fix 3: Install Redis object cache
Effort: Medium
Redis stores query results in memory so duplicate queries don’t hit the database. This directly targets the 236 duplicate queries we found in Part 3.
# Install Redis server
sudo apt-get install redis-server
sudo systemctl enable redis-server

# Install WordPress plugin
wp plugin install redis-cache --activate
// Add to wp-config.php
define('WP_REDIS_HOST', '127.0.0.1');
define('WP_REDIS_PORT', 6379);
define('WP_REDIS_PREFIX', 'yoursite_');
define('WP_REDIS_COMPRESSION', true);
define('WP_REDIS_MAXTTL', 86400); // 24 hours# Enable and verify
wp redis enable
wp redis statusResult after Fix 3:
Average response: 4.3s → 3.1s | Duplicate queries: 236 → 14 | 28% improvement
Fixes 4–7: The remaining gains
Implemented LiteSpeed Cache for full-page caching on non-cart pages, reducing PHP execution on repeat visits. Excluded cart, checkout, and account pages from cache.
Tuned
innodb_buffer_pool_size to 4GB (25% of RAM), increased max_connections to 500, and enabled query cache. Database I/O dropped significantly.
Increased worker processes from 5 to 20, enabled OPcache for bytecode caching, and tuned
pm.max_children for the available RAM. PHP execution time dropped by 40%.
Configured WPML’s built-in string caching to batch-load translations instead of individual queries. The 42 duplicate WPML string queries dropped to 1 per session.
Cumulative results after all 7 fixes
- Avg response time: 20.3s
- p95 response time: 30s
- Error rate: 23%
- DB queries per page: 487
- Duplicate queries: 236
- Avg response time: 3.6s
- p95 response time: 5.2s
- Error rate: 0.8%
- DB queries per page: 89
- Duplicate queries: 14
Up next in this series
Part 5: Results & Lessons Learned
Final K6 test results, what we’d do differently, and the universal principles that apply to any WooCommerce performance project.
Same problem?
We can take your WooCommerce site from broken to fast.
Diagnosis, indexing, caching, server tuning — the full playbook applied to your specific stack.